01 / Reading Guide
Reading Guide
Citation
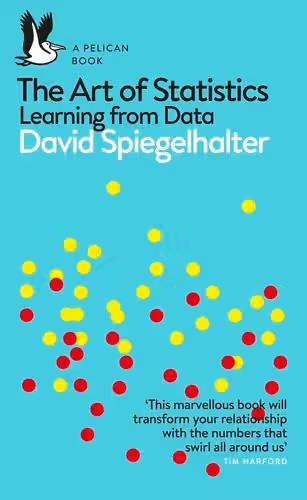
Spiegelhalter, D. (2020). The Art of Statistics: Learning from Data. Pelican (Penguin Books).
Chapter Summary
The book has an introduction, fourteen chapters, a glossary (where the few formulae are collected), notes and an index; the Pelican paperback runs to about 450 pages in a small format. Each chapter is organised around real questions and data sets, and reviewers stress that it teaches statistical reasoning without relying on mathematical formulae. The author maintains a public GitHub repository with the data and R code for the book's figures and tables, together with errata.
Introduction
The book opens with the case of Harold Shipman, the family doctor who murdered many of his patients, and shows how simple graphs of the victims' ages and times of death expose the pattern. It sets out the book's aim: to explain how to learn from data, using problems that range from the benefit of treatments after breast cancer surgery to why old men have big ears.
Chapter 1: Getting Things in Proportion: Categorical Data and Percentages
Using survival data for children's heart surgery, the chapter shows how proportions are presented and how framing changes their effect: a 95% survival rate sounds better than a 5% mortality rate, and counts can sound more alarming than percentages. Odds appear as another way of expressing risk.
Chapter 2: Summarizing and Communicating Numbers. Lots of Numbers
Averages (mean, median and mode) and measures of spread, illustrated with guesses of the number of jelly beans in a jar and with a survey of the reported numbers of lifetime sexual partners. The chapter also covers ways of displaying data, from strip charts to box-and-whisker plots, and correlation and trends over time, such as population growth.
Chapter 3: Why Are We Looking at Data Anyway? Populations and Measurement
The step from the data in hand to the population the data are meant to describe, and the problems of measurement and sampling that come between; birth-weight data are among the examples.
Chapter 4: What Causes What?
Why correlation does not imply causation, illustrated with spurious correlations and misleading newspaper headlines. The chapter explains how study designs such as cohort and case-control studies try to get closer to cause, and introduces Simpson's paradox through admission rates at Cambridge.
Chapter 5: Modelling Relationships Using Regression
Regression starting from Francis Galton's data on the heights of fathers and sons, which gave rise to regression to the mean, and extended to logistic regression for the children's heart surgery data.
Chapter 6: Algorithms, Analytics and Prediction
Prediction and classification, using survival on the Titanic as the running example: classification trees and the danger of over-fitting. A section on the challenges of algorithms lists warning signs such as lack of robustness and implicit bias.
Chapter 7: How Sure Can We Be About What Is Going On? Estimates and Intervals
Uncertainty in estimates: margins of error, the bootstrap as a way of seeing how estimates vary by resampling the data, and the tendency of averages towards a normal distribution.
Chapter 8: Probability – the Language of Uncertainty and Variability
Probability is introduced through the Chevalier de Méré's dice problem and simulation. The chapter covers the Poisson distribution, applied to homicide counts, the prosecutor's fallacy, and the different interpretations of what a probability means.
Chapter 9: Putting Probability and Statistics Together
The chapter that joins the two halves of the book, which a reviewer notes the author flags as perhaps the most challenging. It distinguishes uncertainty about future events from uncertainty about facts that are fixed but unknown, and uses probability models to produce confidence intervals; funnel plots for comparing institutions are among its examples.
Chapter 10: Answering Questions and Claiming Discoveries
Hypothesis testing: null hypotheses and statistical significance, permutation tests, the chi-squared goodness-of-fit test (checking whether homicides follow a Poisson distribution) and sequential testing, applied finally to whether Shipman could have been caught earlier.
Chapter 11: Learning from Experience the Bayesian Way
The Bayesian approach, in which probabilities are updated in the light of evidence, as an alternative to the testing framework of Chapter 10.
Chapters 12–14: How Things Go Wrong; How We Can Do Statistics Better; In Conclusion
The last chapters turn to how statistics go wrong, including questionable practices in research and in its communication, then to practices that would improve how statistics are produced, communicated and judged, and close with a brief summing up.
Key Concepts
Introduction–Chapter 3: Describing data
- Framing: the way the same proportion can be presented positively or negatively, changing how it is perceived.
- Measures of centre and spread: mean, median, mode and range, and when each is appropriate.
- Population and sample: the distinction between the data collected and the group they are meant to represent.
Chapters 4–6: Causation, models and algorithms
- Correlation and causation: why an association alone does not show that one thing causes another.
- Simpson's paradox: a trend that holds in every subgroup but reverses when the groups are combined.
- Regression to the mean: the tendency of extreme measurements to be followed by less extreme ones.
- Over-fitting: building a predictive model so closely around the data that it predicts new cases badly.
Chapters 7–9: Uncertainty and probability
- Margin of error and confidence interval: ranges that express how far an estimate might be from the truth.
- Bootstrap: resampling the observed data to see how much an estimate varies.
- Prosecutor's fallacy: confusing the probability of the evidence given innocence with the probability of innocence given the evidence.
Chapters 10–14: Testing, Bayes and good practice
- Null hypothesis and statistical significance: the default assumption of no effect, and the judgement of whether the data are too surprising for it to be believed.
- Sequential testing: monitoring data as they arrive, while controlling the risk of false alarms.
- Bayesian updating: revising probabilities in the light of new evidence.
- Questionable practices: ways in which the analysis, interpretation and communication of data can mislead.
Critical Analysis
Strengths
- Questions first. Each chapter starts from a real problem, such as Shipman's victims, children's heart surgery, the Titanic or homicide counts, and draws the statistical idea out of it. Reviews quoted by the publisher call it lucid and readable (The Spectator), and Nature says it will serve students well.
- Substantial coverage without formulae. The book reaches regression, prediction algorithms, the bootstrap, hypothesis testing, sequential testing and Bayesian inference, and Popular Science describes it as a thorough introductory grounding achieved without mathematical formulae. The glossary holds the formulae for readers who want them.
- Modern and critical. Chapter 6 treats algorithms and prediction alongside classical statistics, and Chapters 12–13 deal with how statistics go wrong and how practice could be improved.
- Open materials. The author's GitHub repository provides data and R code for the figures and tables (which the author describes as not yet complete), so readers can reproduce and extend the analyses.
Limitations
- Not a textbook. The table of contents shows no exercises, and the book does not drill calculations; students taking a statistics course still need a textbook for technique.
- Uneven pace. Ardian Gill, reviewing the book in Contingencies (January/February 2020), found the discussion of interpretations of probability tedious and noted that some choices, such as rejecting the standard deviation for one data set, are stated without explanation; the author himself flags Chapter 9 as perhaps the most demanding.
- Errors in the text. Gill spotted a reversal in the text describing the Titanic classification tree, and the author's online errata list corrections for both the hardback and the paperback, including the correlation formula in the glossary. Readers should check the errata page.
- British examples. Many cases come from British medicine, crime and public life; readers elsewhere may find some of the context unfamiliar.
Where It Fits in the Course
This is the course's way into statistical thinking, to read before or alongside a first statistics course. Barbara Illowsky and Susan Dean's Introductory Statistics (OpenStax) is the natural companion: a free textbook that teaches the computations for data summaries, confidence intervals, hypothesis tests and regression through worked examples and practice problems, while Spiegelhalter explains why they matter and how they mislead. Blitzstein and Hwang's Introduction to Probability develops the probability of Chapters 8–9 with full rigour and many problems.
Students continuing to mathematical statistics will find the ideas of Chapters 7–11 formalised in Larsen and Marx's An Introduction to Mathematical Statistics and Its Applications, Mavrakakis and Penzer's Probability and Statistical Inference and Casella and Berger's Statistical Inference. More specialised books in the course, such as Williams's Probability with Martingales and Mitzenmacher and Upfal's Probability and Computing, lie well beyond this book's scope.
How to Use This Book
The book suits anyone beginning a degree that uses data, in the sciences, medicine, social sciences or economics, and general readers who want to judge statistical claims. School arithmetic is enough.
Read it in order: the chapters build from describing data (Chapters 1–3) through causation, models and algorithms (Chapters 4–6) to uncertainty, probability and inference (Chapters 7–11), and the final chapters rely on all of these. Take Chapters 9 and 10 slowly. Readers already taking a statistics course can use Chapters 7–11 as a conceptual commentary on the methods taught there.
To go further, download the data and R code from the author's GitHub repository and reproduce a few figures, for example Galton's heights or the Titanic tree, and check the errata as you read. After each chapter, find a news story that uses the same kind of statistic and ask the questions the chapter teaches.