01 / Reading Guide
Reading Guide
Citation
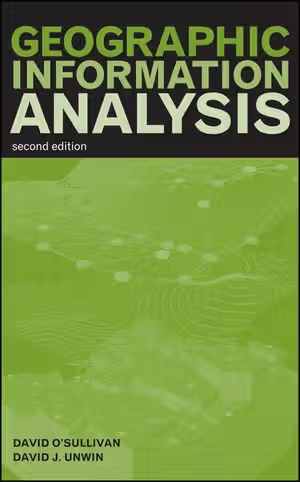
O'Sullivan, D., & Unwin, D. J. (2010). Geographic Information Analysis (2nd ed.). Wiley.
Chapter Summary
The book has twelve chapters and a matrix appendix, about 430 pages in all. Each chapter opens with a list of objectives, and the publisher notes that chapters also carry summaries, "thought exercises", diagrams and their own bibliographies. The second edition added chapters on mapping and geovisualization and on local statistics.
Chapter 1: Geographic Information Analysis and Spatial Data
The opening chapter separates four things often called "spatial analysis": data manipulation inside a GIS, descriptive and exploratory analysis, spatial statistical analysis, and spatial modelling. It then sets out the book's view of spatial data as points, lines, areas and fields, with nominal, ordinal, interval or ratio attributes, and lists complications such as scale dependence, time, uncertain boundaries and fractal objects. It closes with the basic GIS manipulations and the conversions between representations.
Chapter 2: The Pitfalls and Potential of Spatial Data
A two-sided chapter. The "bad news" section covers the problems that make spatial data different from ordinary data, including the ecological fallacy and edge effects; the "good news" section turns to what location makes possible, such as using adjacency and distance to describe relationships among observations.
Chapters 3–4: Fundamentals: Mapping It Out; Fundamentals: Maps as Outcomes of Processes
Chapter 3 treats the map as an analytical tool: the cartographic tradition, geovisualization, Bertin's graphic variables, and ways of mapping and exploring points, areas and fields, ending with the "spatialization" of nonspatial data. Chapter 4 changes viewpoint and treats a pattern as the outcome of a process, covering stochastic processes, how to predict the pattern a process produces, and processes in lines, areas and fields.
Chapters 5–6: Point Pattern Analysis; Practical Point Pattern Analysis
Chapter 5 describes point patterns and assesses them statistically, including Monte Carlo testing. Chapter 6 deals with the practical difficulties: alternatives to classical inference and to the independent random process, inhomogeneity, focused approaches, cluster detection with scan statistics, and proximity polygons.
Chapters 7–8: Area Objects and Spatial Autocorrelation; Local Statistics
Chapter 7 covers types and geometric properties of area objects, then the measurement of spatial autocorrelation, illustrated with tuberculosis in Auckland for 2001–2006. Chapter 8 argues for measuring "locally" and works through the Getis-Ord statistics, inference with local statistics and other local measures.
Chapters 9–10: Describing and Analyzing Fields; Knowing the Unknowable: The Statistics of Fields
Chapter 9 covers modelling and storing field data, spatial interpolation, derived measures on surfaces and map algebra. Chapter 10 moves to the statistics of fields: trend surface analysis, the variogram, and kriging.
Chapter 11: Putting Maps Together: Map Overlay
Boolean overlay and sieve mapping are followed by alternatives: indexed overlay and weighted linear combination, weights of evidence, and regression-based, model-driven overlay.
Chapter 12: New Approaches to Spatial Analysis
The final chapter looks at changing technological and scientific environments, geocomputation, spatial models and grid and cloud computing, and ends by asking what a "neogeographic" information analysis might look like.
Appendix A: Notation, Matrices, and Matrix Mathematics
A self-contained refresher on notation, matrix basics and arithmetic, simultaneous equations, matrices and geometry, and eigenvectors and eigenvalues.
Key Concepts
Chapters 1–2: Spatial Data
- Points, lines, areas and fields: the four basic spatial object types that structure the whole book.
- Ecological fallacy: drawing conclusions about individuals from aggregated area data.
- Edge effects: distortion arising because observations near a study-region boundary have incomplete neighbourhoods.
Chapters 3–6: Maps, Processes and Points
- Graphic variables: Bertin's set of visual dimensions used to encode data on a map.
- Spatial process and pattern: the idea that a map is one realisation of an underlying process.
- Complete spatial randomness (IRP/CSR): the baseline process against which point patterns are tested.
- Monte Carlo testing: assessing a pattern by comparison with simulated random patterns.
Chapters 7–8: Areas and Local Analysis
- Spatial autocorrelation: the tendency of nearby values to be similar.
- Local statistics: measures computed for each location, including the Getis-Ord statistics.
Chapters 9–11: Fields and Overlay
- Interpolation and kriging: estimating a surface from sample points, in the latter case with a statistical model of spatial dependence.
- Variogram: a description of how difference between values grows with distance.
- Weighted linear combination and weights of evidence: ways of combining map layers beyond Boolean overlay.
Critical Analysis
Strengths
- Method over software. The book states its aim as analysing geographic information rather than operating a GIS, and its opening chapter distinguishes analysis clearly from data manipulation.
- Pitfalls come first. A whole early chapter is given to the problems peculiar to spatial data, so later techniques are presented with their assumptions visible.
- Consistent structure by data type. Points, areas, fields and overlay each receive their own chapters, so the reader can see which tools belong to which kind of data.
- Learning aids. Per the publisher and the sample chapter, each chapter has objectives, a review and references, with thought exercises in the text.
- Mathematics is supported. The appendix on matrices lets readers with limited algebra follow the later chapters.
Limitations
- Some statistics and mathematics are expected. Later chapters (variograms, kriging, regression-based overlay) rely on statistical models, and the book includes a matrix appendix; readers new to both will find it a step up from general GIS textbooks.
- Date. Published in 2010, the book predates later developments; its own final chapter presents grid and cloud computing and "neogeography" as emerging.
- Not a software manual. Readers who need button-by-button tutorials will need other sources.
Where It Fits in the Course
This is the course's book on spatial analysis proper. Geographic Information Science and Systems is a broad principles-and-practice textbook that moves from data representation through software and databases to analysis, and Geographic Information Systems Fundamentals is a general introduction to GIS theory and practice; either is a sensible first course before this one. Making Maps, How to Lie with Maps and The New Nature of Maps address design, distortion and the cultural meaning of maps, and complement Chapter 3 on mapping and geovisualization.
How to Use This Book
The book suits students who already know what a GIS does and now want to know how to reason about spatial data: upper-level undergraduates, master's students and practitioners with some statistics.
A practical order is Chapters 1–2 first, as they fix the vocabulary and the pitfalls. Chapters 3–4 are essential background for everything later. Then choose by data type: Chapters 5–6 for point data, 7–8 for area data and 9–10 for continuous surfaces; Chapter 11 follows once layers need combining. Chapter 12 is optional reading on directions of the field. Work through the thought exercises and chapter reviews, and rehearse the techniques on a data set of your own in whichever software you use. Read Appendix A before Chapter 8 if matrix notation is unfamiliar.