01 / Reading Guide
Reading Guide
Citation
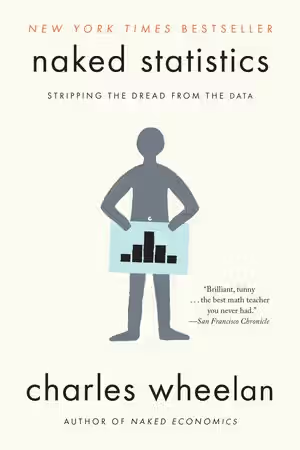
Wheelan, C. (2014). Naked Statistics: Stripping the Dread from the Data. W. W. Norton & Company.
Chapter Summary
The book is a popular introduction to statistical thinking, first published by Norton in 2013 and issued in paperback (about 300 pages) in 2014. It has an introduction, thirteen numbered chapters plus a short half-chapter on the Monty Hall problem, a conclusion and an appendix on statistical software. Each chapter title pairs a statistical topic with a question or provocation. The publisher's description says the book strips away technical detail to focus on the intuition behind statistical analysis, explains inference, correlation and regression, shows how data can be manipulated or misrepresented, and describes how researchers use natural experiments.
Introduction: Why I Hated Calculus but Love Statistics
As its title signals, the introduction contrasts the author's experience of calculus with his enthusiasm for statistics, setting up the book's case that statistics is useful for answering real questions.
Chapter 1: What's the Point?
The first chapter asks what statistics is for, setting up the book's emphasis on the purpose of each tool rather than its mechanics.
Chapters 2–3: Descriptive Statistics (Who Was the Best Baseball Player of All Time?); Deceptive Description ("He's Got a Great Personality!" and Other True but Grossly Misleading Statements)
The book begins with summary measures, using the question of the greatest baseball player as its frame, and then immediately shows how descriptive statistics that are technically true can still mislead. This pairing of a tool with its misuse runs through the book.
Chapter 4: Correlation (How Does Netflix Know What Movies I Like?)
Correlation is introduced through recommendation systems, the kind of everyday application the publisher highlights.
Chapters 5, 5½ and 6: Basic Probability (Don't Buy the Extended Warranty on Your $99 Printer); The Monty Hall Problem; Problems with Probability (How Overconfident Math Geeks Nearly Destroyed the Global Financial System)
Probability is introduced through consumer decisions such as extended warranties; the publisher mentions an example of beer marketers using basic probability. A short interlude treats the Monty Hall game-show puzzle. Chapter 6 then turns to the misuse of probability models, framed around the role of overconfident risk models in the financial crisis.
Chapter 7: The Importance of Data ("Garbage In, Garbage Out")
A chapter on data quality: analysis can be no better than the data it starts from. It sits just before the inference chapters, where the quality of samples becomes central.
Chapters 8–10: The Central Limit Theorem (The LeBron James of Statistics); Inference (Why My Statistics Professor Thought I Might Have Cheated); Polling
The core of the book. The central limit theorem is presented, as the chapter title suggests, as a star among statistical ideas (the publisher mentions a sausage-festival example used to illustrate it), then applied to hypothesis testing and inference, and finally to opinion polling and its sampling error, using a poll figure with its plus-or-minus three percent margin as the chapter's frame.
Chapters 11–12: Regression Analysis (The Miracle Elixir); Common Regression Mistakes (The Mandatory Warning Label)
Regression is introduced as a powerful tool and then immediately followed by a chapter of warnings about its misuse.
Chapter 13: Program Evaluation (Will Going to Harvard Change Your Life?)
The final chapter asks how to tell whether a programme or treatment causes an outcome, the problem that the publisher says researchers address with natural experiments.
Conclusion and Appendix
The conclusion sets out five questions that statistics can help answer, and the appendix briefly discusses statistical software.
Key Concepts
Chapters 1–4: Description and correlation
- Descriptive statistics: summary numbers, such as averages, that condense a large body of data.
- Deceptive description: statistics that are accurate but chosen or framed to mislead.
- Correlation: the degree to which two variables move together, which is not proof that one causes the other.
Chapters 5–7: Probability and data
- Probability and expected value: reasoning about uncertain outcomes, applied in the book to everyday decisions such as warranties.
- The Monty Hall problem: a game-show puzzle in which the intuitive answer about probability is wrong.
- Model risk: the danger of placing too much confidence in probability models, the subject of Chapter 6.
- Data quality: "garbage in, garbage out"; conclusions depend on how the data were collected.
Chapters 8–10: Inference
- Central limit theorem: the result that sample means are approximately normally distributed around the population mean, which makes inference from samples possible.
- Statistical inference: using sample data to judge hypotheses about a population.
- Sampling error: the margin by which a poll's result may differ from the true population value.
Chapters 11–13: Regression and causation
- Regression analysis: estimating the relationship between an outcome and several explanatory variables at once.
- Regression mistakes: the common ways regression results are misused, collected in Chapter 12.
- Program evaluation: methods for estimating whether a programme or treatment causes an outcome, including natural experiments.
Critical Analysis
Strengths
- Readable intuition for non-specialists. Tom Siegfried, reviewing it in Science News (January 2013), praised its humour and conversational style and the way it uses real-world examples to show how statistics work and why they matter. Michael T. Catalano, reviewing it in Numeracy (2015), judged that a moderately diligent learner can gain a decent understanding of basic statistics from it.
- Examples teachers can use. Catalano also noted that teachers of statistics and quantitative literacy will find many well-told examples and stories to use in class. The chapter titles show the approach: each method is introduced through a question, from baseball to film recommendations to university admissions.
- Attention to misuse. Misleading description, probability models in the financial crisis, data quality and common regression mistakes each get a chapter, so the book teaches readers to question statistical claims, not only to compute them.
- A complete arc in a short book. In about 300 pages it moves from description through probability and inference to regression and causal evaluation, the same sequence as a first statistics course.
Limitations
- Not a methods text. The book deliberately strips away technical detail to focus on intuition, and its contents list no exercise sets; it does not train readers to carry out analyses. It cannot replace a textbook for a course that is assessed on calculation.
- No Bayesian statistics. Siegfried points out that the book ignores Bayesian methods, which he considers often more appropriate for the problems it discusses.
- A tension in the message. Siegfried also notes that the warning-label chapter on regression mistakes admits that a great deal of expert research turns out to be wrong, while most of the book presents standard methods as the way to the right answer. Readers should take Chapters 6, 7 and 12 as qualifications of the rest.
- American examples. Many examples come from US sport, politics and education, which some readers elsewhere will find less familiar.
Where It Fits in the Course
In this business statistics course, Wheelan's book is the only non-technical title. Levine, Szabat and Stephan's Business Statistics: A First Course and Sharpe, De Veaux and Velleman's Business Statistics are full textbooks that teach the methods with business cases, software output and exercises, and Newbold and colleagues' Statistics for Business and Economics is a comprehensive text covering descriptive and inferential methods, regression and time series. Jacques's Mathematics for Economics and Business covers the mathematics rather than the statistics.
The best use of Naked Statistics is before or alongside one of the textbooks: read it in the weeks before the course starts, or chapter by chapter as the course reaches each topic, to get the intuition and the cautionary examples that a methods text has less room for. It should not be used instead of a textbook.
How to Use This Book
The book is written for general readers and students who find statistics intimidating; school algebra is enough. It also suits students who have completed a statistics course mechanically and want to understand what the methods mean.
A practical reading plan:
- Read it straight through. The book is short and cumulative: Chapters 2–7 supply the ideas (averages, correlation, probability, data quality) that Chapters 8–13 rely on. The introduction and Chapter 1 can be read quickly.
- Core for a business statistics course: Chapters 2–4, 8–9 and 11–12, matching the descriptive statistics, sampling distributions, hypothesis testing and regression units of a typical course.
- Do not skip the warning chapters. Chapters 3, 6, 7 and 12 are the book's main contribution beyond intuition; they are the material most useful for judging claims in reports and the media.
- Chapter 13 for later courses. Program evaluation and natural experiments lead towards econometrics and policy analysis.
Because the book is not built around exercises, pair each chapter with the corresponding problems from the course textbook. A useful habit is to take one statistic from the news each week and ask the book's questions of it: how the data were collected, what the summary hides, and whether a correlation is being presented as a cause.