01 / Reading Guide
Reading Guide
Citation
Field, A. (2024). Discovering Statistics Using IBM SPSS Statistics (6th ed.). SAGE Publications.
Chapter Summary
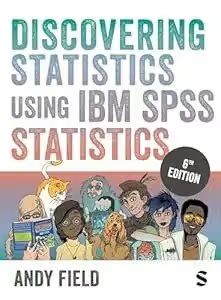
The sixth edition has 22 chapters and runs to 1,144 pages. SAGE describes it as combining humour with step-by-step instruction, moving from initial theory through regression, factor analysis and multilevel modelling, and animating statistics and SPSS with the author's bizarre examples and activities. The listed features include flexible coverage across disciplines, analysis of real data, highlighting of common misconceptions and errors, and a revamped online resource of video, case studies, datasets and test banks. The book covers the range of versions of IBM SPSS Statistics. The contents fall into five stages: foundations, the software, the linear model and its comparisons of means, multivariate and categorical methods, and multilevel models.
Chapters 1–3: Why is my evil lecturer forcing me to learn statistics?; The SPINE of statistics; The phoenix of statistics
The first chapter covers the research process: initial observation, theories and hypotheses, measurement, research design and reporting data. Chapter 2 builds statistical models around the mnemonic SPINE: standard error, parameters, interval (confidence), null hypothesis significance testing and estimation. Chapter 3 then takes up the problems with null hypothesis significance testing and places them within wider problems in science. A section titled "A phoenix from the EMBERS" leads into sections on sense, preregistration and open science, effect sizes and Bayesian approaches.
Chapters 4–6: The IBM SPSS Statistics environment; Data Visualisation; The beast of bias
Chapter 4 introduces the software: versions, the Data Editor, importing data, the Viewer, the Syntax Editor and extensions. Chapter 5 teaches graphing with the Chart Builder, from histograms and boxplots to error bars and scatterplots. Chapter 6 covers bias, outliers, the assumptions of the linear model and how to detect and reduce violations.
Chapters 7–9: Non-parametric models; Correlation; The Linear Model (Regression)
Chapter 7 presents rank-based tests for two or several independent or related groups. Chapter 8 covers bivariate, partial and semi-partial correlation, and Chapter 9 introduces the linear model with one predictor and several, with sections on sample size, robust regression and Bayesian regression. The linear model is the base for what follows.
Chapters 10–11: Comparing two means; Moderation and Mediation
Chapter 10 introduces categorical predictors in the linear model and then the t-test, for independent and related means. Chapter 11 covers interactions and mediation, using the PROCESS tool.
Chapters 12–16: GLM 1 to GLM 5
Five chapters extend the model to categorical predictors: comparing several independent means (including contrasts and post hoc procedures), analysis of covariance, factorial designs, repeated-measures designs, and mixed designs. Several of them include robust and Bayesian alternatives, and most cover effect sizes and the reporting of results.
Chapters 17–18: Multivariate analysis of variance (MANOVA); Exploratory factor analysis
Chapter 17 introduces matrices, the theory behind MANOVA and follow-up discriminant analysis. Chapter 18 covers factor analysis and also reliability analysis.
Chapters 19–22: Categorical outcomes: chi-square and loglinear analysis; Categorical outcomes: logistic regression; Multilevel linear models; Epilogue
Chapters 19 and 20 treat categorical outcomes, from chi-square and loglinear analysis to binary and multinomial logistic regression. Chapter 21 covers hierarchical data, multilevel models and growth models. Chapter 22 is an epilogue.
Key Concepts
Chapters 1–3: Foundations
- The SPINE of statistics: standard error, parameters, interval and null hypothesis significance testing as the core of model-based inference.
- Problems with NHST: the criticisms that motivate effect sizes, open science and Bayesian approaches.
- Effect sizes and Bayes factors: reported alongside or instead of significance tests.
Chapters 4–9: Software, Assumptions and the Linear Model
- Bias and assumptions: outliers, normality, linearity, homoscedasticity and independence.
- Non-parametric tests: alternatives when assumptions fail.
- The linear model: regression with one or several predictors, taught as the base for later chapters.
Chapters 10–22: Comparing Means, Multivariate Methods and Multilevel Models
- The general linear model: t-tests, ANOVA, ANCOVA and repeated-measures designs presented as versions of one model.
- Moderation and mediation: interactions and indirect effects.
- Multivariate and categorical methods: MANOVA, factor analysis, chi-square, loglinear and logistic models.
- Multilevel models: analysis of hierarchical data and growth.
Critical Analysis
Strengths
- Unified view of the linear model. Chapter 9 presents regression, Chapter 10 moves to comparing two means, and Chapters 12 to 16, titled GLM 1 to GLM 5, extend the same approach to ANOVA designs, so the many tests appear as variations on one model rather than a menu of unrelated procedures.
- Open treatment of the limits of significance testing. A whole chapter on problems with NHST, effect sizes, preregistration and Bayesian approaches, followed by robust and Bayesian sections in the later chapters, prepares students for current practice.
- Practical reporting guidance. Most analysis chapters include a section on how to report the result, which supports lab reports and dissertations.
- Wide coverage in one volume. The book goes from basic research design to MANOVA, factor analysis and multilevel modelling, so one text can serve several courses. The publisher stresses flexible coverage, real data and common misconceptions and errors.
Limitations
- Tied to SPSS. The software appears in the title and in many section headings; students using R, jamovi or other software will use the concepts but not the click paths.
- Length. At 1,144 pages the book is far more than one course; readers should follow a selected route.
- Methods not covered. The contents list no chapters on structural equation modelling, time series or survival analysis, which students in some fields will need elsewhere.
Where It Fits in the Course
Field's book is the practical, software-based statistics text on this list. Reidy and Dancey's Statistics without Maths for Psychology is also SPSS-based and explains the logic in words and graphs rather than formulae, so it suits students who want the gentlest route; Field's contents reach factor analysis, logistic regression and multilevel models, which the description of the other book does not list.
For research design, Jhangiani and colleagues' free Research Methods in Psychology and Morling's Research Methods in Psychology teach how studies are designed and interpreted and pair with Field's Chapters 1 to 3. Maxwell, Delaney and Kelley's Designing Experiments and Analyzing Data is a graduate treatment of ANOVA through model comparison and is a good next step after Chapters 12 to 16. McElreath's Statistical Rethinking is a Bayesian course in R and Stan, and follows naturally from the Bayesian approaches introduced in Field's Chapter 3.
How to Use This Book
The book is aimed at students in psychology and the social sciences, from undergraduates to postgraduates, who need to run and report analyses in SPSS. The publisher does not list prerequisites.
A sensible route is Chapters 1 to 6 for the foundations, the software and assumptions, then Chapters 8 to 10 for correlation, regression and comparing two means. Chapters 12 to 14 cover most undergraduate ANOVA content, and Chapters 15 and 16 are added when repeated-measures and mixed designs appear. Chapters 11 and 17 to 21 are for advanced courses and projects, taken as needed.
Work at the keyboard: use the data sets and the revamped online resource, repeat the analyses, and write up each result using the reporting sections. For ideas rather than clicking, the SPINE and EMBERS chapters repay a second reading.